Edit the links between the chart and the comparison grid
Chart viewer consists of multipane charts. This means that the chart view can have one or more panes and each pane can display a chart with a single or multiple series linked with the columns (data) of a comparison grid.
The charts on the panes can scroll and zoom synchronously or can also do this independent of each other.
-
Create a pane
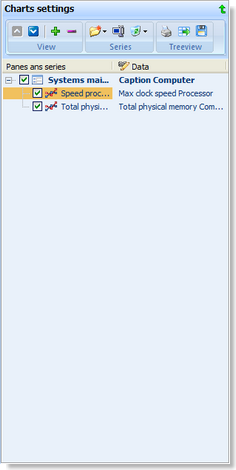
First create one or many panes which will include somes series by clicking on the button 'Add a pane or a serie'

and choose the line 'Add a pane' in the dropdown menu. A new pane with a default name is added into the treeview, edit the name and press enter or click outside the control. The title of the pane is automatically reported in the chart viewer. Then, in the same row, click in the 'Data' column to select a column of the comparison grid. This column will be used for the x-Axis label of the pane.
-
Create a serie
Now, you can add some series to the new current pane by clicking on the button 'Add a pane or a serie'
and choose the line 'Add a serie' in the dropdown menu. A new serie with a default name is added into the treeview, edit the name and press enter or click outside the control. Then, in the same row, click in the 'Data' column to select a column of the comparison grid. After validation, the serie is immediately drawn in the parent pane of the chart viewer.
-
Modify an item
First, select an item in the treeview then click on the 'Rename selection' button

. Perform the changes then, press 'enter' or click outside the control. Each modification is immediately delayed in the parent pane of the chart viewer.
-
Delete an item or all
First, select an item in the treeview, click on the 'Delete selection' button

then choose the line 'Delete the selection' or 'Delete all' in the dropdown menu and confirm your choice. The structure of the comparison grid is not changed !
Change the panes and series order
You can change the order of drawing of the panes and the series in a pane. To do this, select an item in the treeview and click on one of the 'move selection' buttons (previous

or next

) on the chart treeview toolbar or on one of the 'Move' line in the contextual menu. You can change, too, the order of the panes by making a '
Drag&Drop' into the canvas of the chart viewer.
Expand and collapse the panes
Futhermore, you can expand

or collapse

the panes nodes.
Export and print the treeview
Like all other treeview, you can print

and export

this treeview in different formats ('DOC', 'HTML' or 'TXT').
Save the settings
When you have finished your settings, click on the 'Save the chart settings' button

on the chart treeview toolbar or on the 'Save settings' line in the contextual menu. This function save in one time the treeview and the graphical settings of the chart in two files.