| Welcome | Charts |
|---|
| Welcome | Charts |
|---|
|
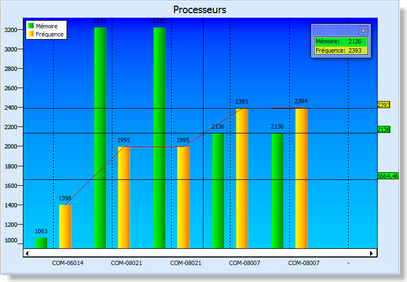
Invent Upshot can combine advanced charts to the comparisons grids to enhance and improve the readability of comparisons. This powerful tool is designed to display different kinds of data. Its graphical user interface supports vertical or horizontal orientation, 2D or 3D chart types such as bar, cylinder, pyramid, histogram, area, line, ohlc, candlestick, and many variants like stacked bar, stacked area, stacked percentage area, stacked percentage bar… it is easy to use with features like multiple chart panes, scrolling, scaling, synched chart panes, synched crosshairs, zoom control window and many more ... |
|---|---|
© 2009, 2010 Aplixio. All rights reserved |
|